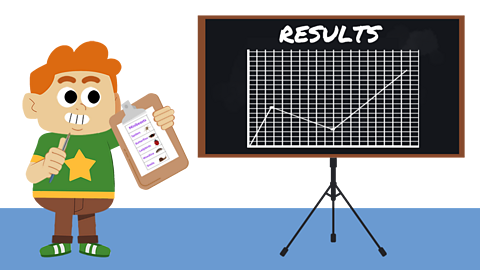
How do scientists record and represent their findings?
Once a scientist has thought about a question that they would like to discover the answer to, they need to decide on the best way to find out the answer.
This might be an experiment, a test or some observations.
These will give them some data which they can use to help answer their question. But how do scientists record their findings and keep track of what they have found out?
What might scientists use to record their findings?
Scientists might use:
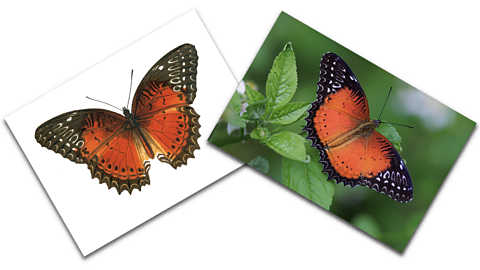
Drawings or photographs
Drawings or photographs are good when you are making observations of things, such as plants or animals. They can help scientists to spot and record different features such as how many legs an insect has or the pattern on a butterfly’s wings.
You can also use lots of drawings or photographs to record how something changes over time, such as how a bean plant changes each day as it is growing. Drawings usually have a lot of detail so that you can see the different features that something has very clearly.
Labelled diagrams
A labelled diagram is useful to show the different parts that something has. You can label a diagram of an animal to name the different body parts, or you can label a diagram of an object to show the materials that different bits are made from.
Tables
Tables are a bit like a grid or boxes on paper that you can use in lots of different ways. You can put pictures in a table and tick them off when you find them on a scavenger hunt, like signs of Spring, or different materials around school. You can record a list of birds that you find in different places (a garden, a park, a school, a beach) in a table, or record the number of seconds it takes your friend to run around the playground.
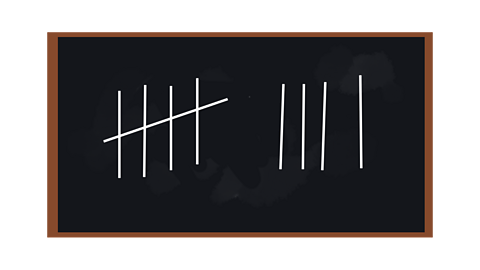
Tally charts
A tally chart is a type of table and it is great if you need to count things!
A tally is a short line, a bit like a number one, and you draw a line each time you count one thing. When you get to 5 things, you draw a line across the first four to make a gate. Tally charts make it easy to find the total number of things, such as the number of star jumps each of your friends can do in a minute, the number of each type of minibeast you count in a bug hotel or the number of flowers of each colour in a garden. You can then count up your tally marks to see which has the most!
Watch: Collecting data and representing findings
Anna: Scientists are always looking at the world around them, asking questions and gathering new information which they collect and record in different ways.
The information scientists discover and record is called data.
Scientists decide on the best way to share this data with others. They work together to discuss, understand, look for patterns, or compare their information.
We're here at the botanical gardens to gather some information about plants and look at the different ways that we can record it.
We're measuring their height in centimetres using a tape measure and recording it in a table. Start from zero centimetres and measure down, and read off how tall it is. What's that number? 91, very good! Look, someone else is recording the plants features - is it tall and straight or short and bushy? They're drawing what the plants look like and adding labels too.
Now that we've finished our research and collected our data, we can present it to each other. This is a bar chart. It shows the height of the plants, and each bar is a different plant.
And these are the drawings that we've made of the features of the plants, and we've presented them in the journal. Not only can we share our findings using graphs and drawings, we can use tally charts too.
For example, we counted the number of plants in the greenhouse with flowers and drew lines to record each plant so we didn't lose count. Every fifth count is marked with a strike across the previous four lines to indicate five plants with flowers.
Sharing information helps people learn about the world. What kind of data could you collect, and how would you share that information?
Discover how to record and represent your findings when working scientifically.
Child: So, are there more birds than mammals in the park?
Molly: That’s what I’m trying to figure out.
Ah, a magpie - definitely a bird!
Log that one and load tally table.
Narrator: A great way to record data! A chart would help us to review it though…
Molly: Ok, load chart.
Narrator: This line chart shows the number of birds and mammals over the whole week.
Molly: We can easily see there are more birds.
Where did that magpie go?
Child: Oh!
Fascinating facts about famous scientists
- Sir Alexander Fleming (1881–1955) developed the medical drug penicillin in 1928 by accident. It has since saved many millions of lives.
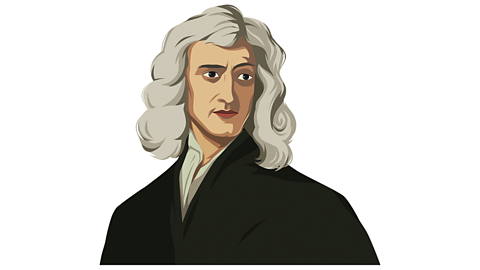
- Sir Isaac Newton (1643–1727) was a physicist who developed the theory of gravity in 1665, supposedly after an apple fell on his head.
- Marie Curie (1867–1934) was awarded the Nobel Prize twice, for physics in 1903 and chemistry in 1911. She invented the term ‘radioactivity’ and discovered the elements polonium and radium.
- Professor Stephen Hawking (1942–2018) was an English physicist who became an expert on black holes.
- Hippocrates (460–375BC) was a Greek doctor who was known as the Father of Medicine.
- Alan Turing (1912–1954) was a mathematician and computer scientist. He designed a machine known as the ‘Bombe’ which helped to break the secret German Enigma code during the Second World War. After the war he created some of the world's first modern computers, some of which can be see in the Science Museum in London.
- Mary Anning (1799–1847) was a British fossil collector and palaeontologist. Anning was a pioneer of collecting, and displaying fossils. She identified several fossils of ichthyosaurs, plesiosaurs, and pterosaurs.
- Florence Nightingale (1820–1910) was a British statistician and the founder of modern nursing. Nightingale was a hospital manager in the Crimean War where she famously reduced death rates significantly by improving hygiene. She was known as The Lady with the Lamp as she travelled around the wards caring for soldiers.
Answering questions
Once a scientist has recorded their findings they can use these to answer their question. They can then present what they have found out to others by writing down their conclusion, or telling someone all about it.
Sometimes they might need to represent their findings in a different way to help explain what they have found.
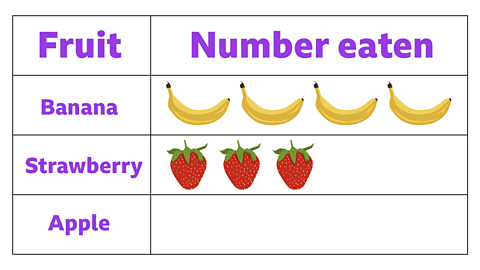
Pictogram
A pictogram is a type of table that often uses one small picture to represent each thing counted.
The more pictures there are in a column or row, the more things have been counted.
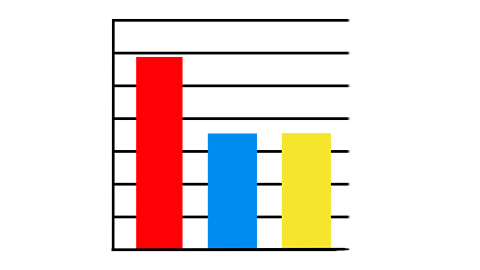
Bar charts
A bar chart (or graph) has lots of uses. Each coloured bar can represent an amount of a different thing, such as the height of different plants or the amount of rain that has fallen on different days.
The height of the bars make it easy to compare amounts because the taller the bar, the higher the amount!
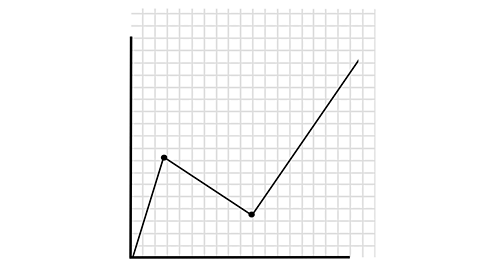
Line charts
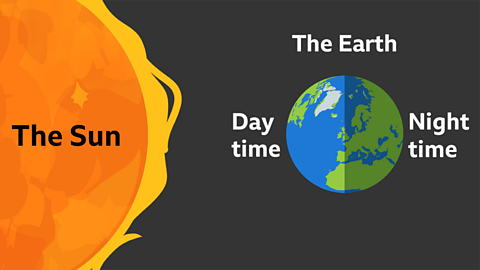
A Line chart (or graph) would be used to show changes over time e.g. the changes in the number of birds at different times of the same day. If you were looking at birds across a week, each day is a discrete data set so you would use a bar chart.
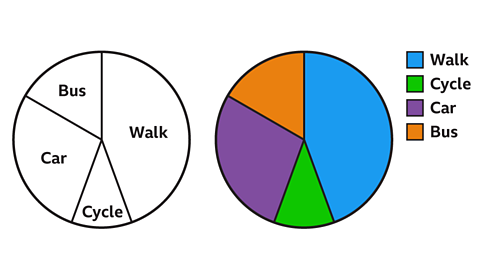
Pie charts
A pie chart is a circle that is split into sections – a bit like a pie! The segments on a pie chart show the amount of something – the large the segment the higher the amount, and the smaller the segment the smaller the amount. Scientists might use a pie chart to show how many of each different minibeast were found under a log.
The five enquiry skills
There are five enquiry skills we can use to think like scientists and to help us collect some data:

Image caption, 1 – Pattern seeking
Scientists look for patterns in data.


1 of 5
Did you know?
Historians have learned a lot about past scientists and their discoveries by looking at the findings they recorded.
Albert Einstein, who did lots of research into gravity, kept a special notebook where he drew diagrams and made notes on the things he found out.
Charles Darwin, who studied plants and animals, and Florence Nightingale, who explored how to make people well when they were ill, even published famous books of their findings!
Important words
Bar chart – A chart or graph that uses rectangular shaped bars to show results and data.
Experiment – A scientific procedure, often in a laboratory, that produces results.
Graph – A visual display of results and data using either bars, a pie diagram or lines.
Observations – Viewing and noticing patterns and unusual things in scientific experiments, tests and data.
Results – Information and data received at the end of a test or experiment.
Pie chart – A chart shaped in a circle with different sections, like the pieces of a pie, that shows results and data.
Tally charts – A simple way of collecting and presenting data using a mark to count.
Test – A test is carried out to see what happens.
Activities
Activity 1 – Quiz

Activity 2 – Collecting data
You will need a pencil and some paper for this activity
Next time you're outside with an adult go and collect your own set of data and record it using tally marks.
You could record a tally of:
- different trees or flowers you can spot
- different colours of cars
- different birds, insects or animals that you see
Set yourself a time limit of ten minutes to collect the data.
Once you have collected your data, think about the best way you could represent it.
Are you going to draw a picture, bar chart or pictogram?
What conclusions can you draw from your data?
Activity 3 – Make a tally chart
Easter Holidays Activity Pack activity
Check out some Easter inspired activities to complete in the Easter Holidays, for KS1.

More on Working scientifically
Find out more by working through a topic
- count1 of 3

- count2 of 3