What are pie charts?

Pie charts are a way to show data. Pie charts show proportions of a whole.
The circle of the pie chart represents the whole. That's a full 360 degrees.
Each part, or slice, represents part of the whole. The bigger the slice, the larger the part it represents.
The whole pie chart represents 100% of something.
Activity: How to read pie charts
Complete this interactive activity to understand how to read and understand the information in pie charts. Then test your knowledge.
Using a pie chart
Take a look at this pie chart. It shows how Year 6 children travel to school.
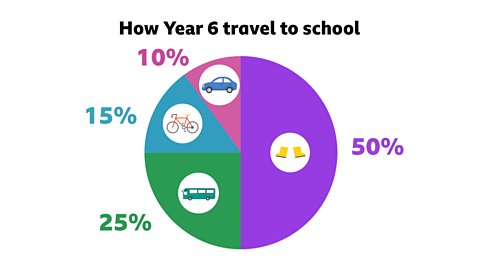
What can you work out from this pie chart?
Most children walk to school, because it represents the biggest slice.
The smallest slice shows that the fewest children come by car.
If the walking slice is half of the pie chart, it means 50% of children walk.
If the bus slice is a quarter of the pie, it means 25% of children take the bus.
There are 40 children in Year 6.
50% or half of 40 is 20. So 20 children walk to school.
25% or a quarter of 40 is 10. So 10 children take the bus.
Angles in a pie chart
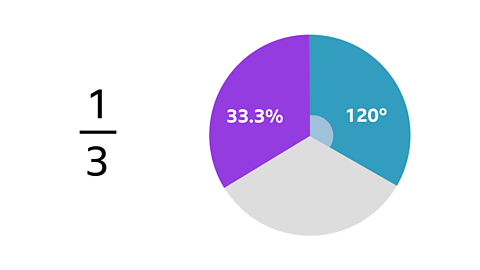
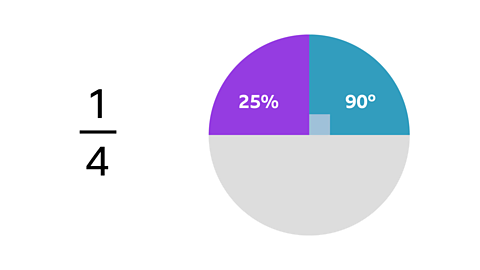
Here are some helpful angles to remember in a pie chart.
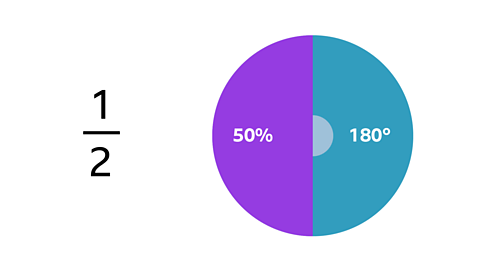
Image caption, Half (50%): 180 degrees of the pie chart.
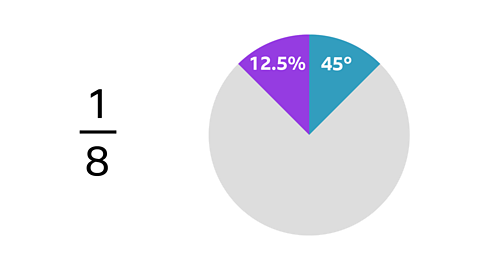
1 of 4
Example 1
Lucy's football club is made up of defenders, attackers, midfielders and goal keepers.
This pie chart shows the proportions of each type of player at her club.
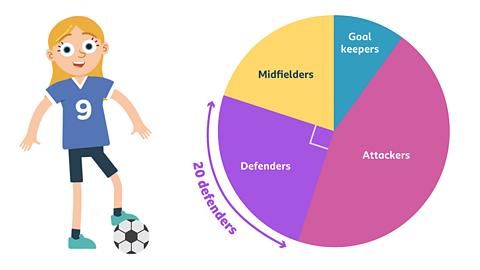
You can see that one quarter of the pie chart represents the number of defenders.
You know this because it looks like an exact quarter, but also because the right angle inside the part shows us it is 90°.
A quarter of 360° (the complete circle) is 90°.
If there are 20 defenders, how many people play at Lucy's club in total?
✓ A quarter of the whole pie chart represents 20 people.
A quarter is one of four equal parts, so if you multiply a quarter of the pie chart by 4, you can find out what the whole is. So:
20 x 4 = 80
That means there are 80 players at Lucy's football club.
Example 2
In this example, there are two pie charts.
When you have two pie charts, you can compare two different sets of results.
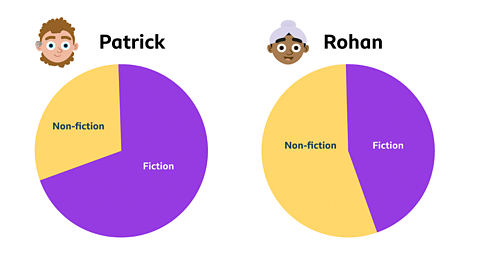
These pie charts shows the number of types of book read by both Patrick and Rohan.
The pie charts are separated into 'Fiction' books and 'Non fiction' books.
True or false - Patrick reads more fiction books than Rohan.
✓ This could be true or it could be false.
This is because you have not been told the total amount of books that Patrick and Rohan have read.
If you knew the total number of books they had read, then you could work out what the amount of each part of the pie chart represents.
However, it would be true to say that Patrick read a greater proportion of fiction books than Rohan.
Example 3
The pie chart below represents the number of children in drama club. The club is rehearsing 3 different plays.
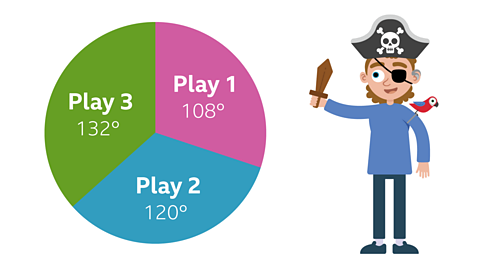
You are given the angles of the section for each play:
Play 1 - 108°
Play 2 - 120°
Play 3 - 132°
Play 1 has the fewest children in it because it has the smallest angle.
Play 3 has the most children in it because it has the largest angle.
If the total number of children in drama club is 60, can you find out how many students are in each play?
✓ First work out how many degrees represents one child.
You can can divide the total number of degrees in the circle (360°) by the total number of pupils (60).
360° ÷ 60 = 6°
This tells you that 6° represents one pupil.
You can then divide the angle of each slice by 6 to work out how many children it represents.
Play 1:
108° ÷ 6° = 18 children
Play 2:
120° ÷ 6° = 20 children
Play 3:
132° ÷ 6° = 22 children
You can check your answer, by adding the number of children in all the plays together:
18 + 20 + 22 = 60 children
Play our fun maths game Guardians: Defenders of Mathematica. game
Use your times tables and more maths skills to defeat monsters and reclaim the Kingdom of Mathematica

More on Tables, graphs and charts
Find out more by working through a topic
- count7 of 7

- count1 of 7

- count2 of 7

- count3 of 7