Representing data
Bar charts
Learn about bar charts with this BBC Bitesize Maths article. For students between the ages of 11 and 14.

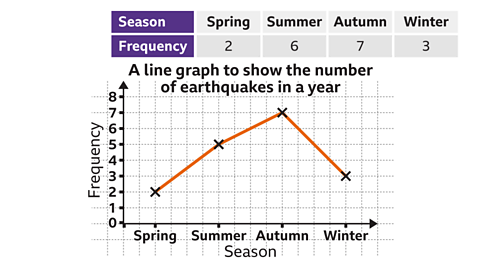
Line graphs
Learn about line graphs with this BBC Bitesize Maths article. For students between the ages of 11 and 14.
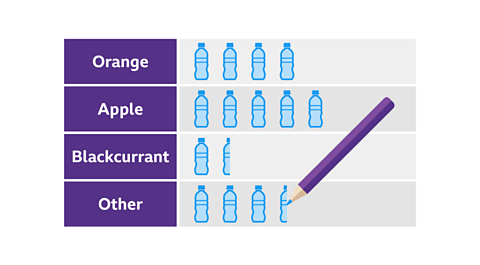
Pictograms
Learn about pictograms with this BBC Bitesize Maths article. For students between the ages of 11 and 14.
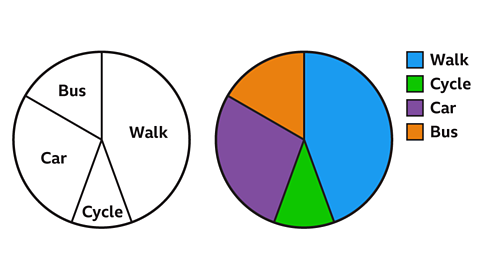
Pie charts
Learn about pie charts with this BBC Bitesize Maths article. For students between the ages of 11 and 14.
Frequency diagrams and frequency polygons
Learn more about frequency diagrams and frequency polygons with this BBC Bitesize Maths article. For students between the ages of 11 and 14.

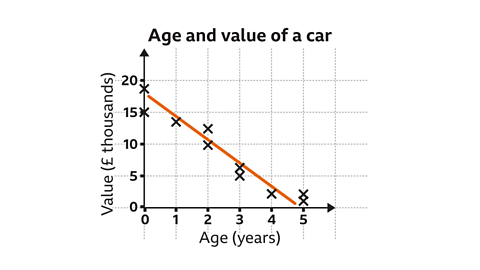
Scatter diagrams
Learn more about scatter diagrams with this BBC Bitesize Maths article. For students between the ages of 11 and 14.
Links
- External linkExternal link
- SubscriptionSubscription
- External linkExternal link
- External linkExternal link
- SubscriptionSubscription
- External linkExternal link
- SubscriptionSubscription